

Proc. Natl. Acad. Sci. USA Vol. 88, pp. 5680-5684, July 1991
GREGG L.SEMENZA, MARY K.NEJFELT, SUZIE M.CHI, AND STYLIANOS E.ANTONARAKIS
ABSTRACT Human erythropoietin gene expression in liver and kidney is inducible by anemia or hypoxia. DNase I-hypersensitive sites were identified 3' to the human erythropoietin gene in liver nuclei. A 256-base-pair region of 3'flanking sequence was shown by DNase I protection and electrophoretic mobility-shift assays to bind four or more different nuclear factors, at least two of which are induced by anemia in both liver and kidney, and the region functioned as a hypoxia-inducible enhancer in transient expression assays. These results provide insight into the molecular basis for the regulation of gene expression by a fundamental physiologic stimulus, hypoxia.
In mammals, erythropoietin (EPO) is the primary humoral regulator of red blood cell production and thus of blood oxygen-carrying capacity. EPO RNA levels increase several hundredfold in rodent liver and kidney in response to anemia or hypoxia (1, 2). EPO gene expression is believed to be induced by hypoxia or anemia via a single mechanism (reviewed in ref. 3). The signal sensed by EPO-producing cells is probably a decrease in local tissue oxygen tension, whether due to decreased blood oxygen-carrying capacity (anemia) or decreased ambient oxygen concentration (hypoxia). EPO gene expression in Hep3B human hepatoma cells can be induced in 1% O2(4, 5), demonstrating that the same cell type can sense hypoxia and respond by increasing its steady-state level of EPO RNA. Nuclear extracts prepared from Hep3B cells cultured in 1% O2 support a higher level of EPO gene transcription in vitro than extracts from cells cultured in 20% O2(6). EPO gene expression in Hep3B cells (4, 5) and in vivo (2, 7) can also be stimulated by CoC12 administration.
By introducing DNA containing the human EPO gene into the mouse genome via pronuclear microinjection, we have identified cis-acting DNA sequences that regulate tissuespecific, inducible human EPO gene expression. Transgenes of 4 kilobases (kb) (tgEP04) and 10 kb (tgEPO10) containing the human EPO gene, a 3' flanking region of 0.7 kb, and 5' flanking regions of 0.4 kb and 6 kb, respectively, are inducibly expressed in adult liver but not in kidney (8, 9). In the liver of anemic tgEPO10 mice, human EPO RNA is synthesized specifically by perivenous hepatocytes and the amount of EPO RNA per cell increases as anemia is made more severe (10). When tgEPO4 or tgEPO10 mice are made anemic, human EPO RNA increases by several orders of magnitude in liver compared with the uninduced state, indicating the presence of sequences mediating inducible liver expression in close proximity to the human EPO gene (8, 9).
MATERIALS AND METHODS
DNase I-Sensitivity Studies. Nuclei were isolated and then digested with DNase I at 0, 1, 2, or 5 μg/ml for 2 min at 25°C, and DNA was isolated as described (11).
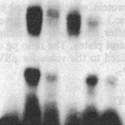
Nuclear Extracts.Liver (41 g) and kidney (12.6 g) were isolated from 21 untreated mice, kidney (7.6 g) was isolated from 15 anemic mice treated with phenyihydrazine (mean hematocrit, 24%), and liver (9.7 g) was isolated from 5 phenylhydrazine-treated mice (mean hematocrit, 21%). Phenylhydrazine was given i.p. (60 μg/g of body weight) every 12 hr starting 36 hr prior to sacrifice. Tissue was frozen in liquid nitrogen and stored at -80°C.Nuclei were isolated as described (12, 13), except that all buffers contained aprotinin, leupeptin, and pepstatin (Sigma), each at 2 μg/ml.
DNase I Footprint Analysis. A 256-base-pair (bp) sequence extending 3' from within the human EPO gene polyadenylylation signal was amplified by polymerase chain reaction (PCR) using 5' end-labeled primers shown in Fig.3. Amplification was as follows: 6 min at 94°C; 30 sec at 94°C, 45 sec at 50°C, 45 sec at 72°C, for 30 cycles; and 10 min at 72°C. For footprint analysis (12, 14), PCR probe (7500 cpm; 0.4 ng) was incubated with 40 μg of nuclear extract protein and 1 μg of poly(dI-dC) (Pharmacia) in 80 μl of 10 mM Hepes, pH 7.9/10% (vol/vol) glycerol/50 mM KCl/5 mM MgCI2/0.1 mM EDTA/0.75 mM dithiothreitol for 15 min on ice, followed by 2 min at 25°C, and DNase 1 (0.3 μg) was added for 1 min at 25°C. DNA was extracted, precipitated, resuspended in formamide, and analyzed by 8 M urea/8% PAGE.
Gel Shift Assays. Complementary oligonucleotides were synthesized with HindⅢ (sense strand) and EcoRI (antisense strand) 5' overhangs, except OL-21, -23, and -33, which were composed entirely of EPO gene sequences. The sense strand was end-labeled using phage T4 polynucleotide kinase and [y-32P] ATP and annealed to a 10-fold excess of antisense strand. Double-stranded probe was purified by 10% PAGE and elution in 10 mM Tris·HCI, pH 7.5/50 mM NaCl. Probe (1-2 x 10⁴ cpm; 30-150 pg) was incubated with 1 μg of nuclear extract and 2-4 μg of poly(dI-dC) in 20 μl of 10 mM Tris·HCI, pH 7.5/12.5% glycerol/50 mM KCL/5 mM MgCI2/1 mM EDTA/0.1% Triton X-100/1 mM dithiothreitol for 30 min at room temperature after preincubation of all components except probe for 15 min. After preelectrophoresis for 1 hr, 5% PAGE was performed in 50 mM Tris·HCI/380 mM glycine/2 mM EDTA, pH 8.5, at 180 V for 2 hr at 4°C. The gel was dried and autoradiographed at -80°C for 1-5 days.
Transient Expression Studies. Plasmids contained the simian virus 40 (SV40) basal promoter, bacterial chloramphenicol acetyltransferase (CAT) coding sequence, and the SV40 splice site and polyadenylylation signal (pCAT-promoter, Promega; here designated pSVcat). On the 3' side of these sequences was either a 236-bp SV40 enhancer element (pCAT-control, Promega; here designated pSVcatSV), a 256-bp PCR product, or a 2.5-kb Bgl II-BamHI fragment, with the latter two inserted into the BamHI site of pSVcat. Plasmid DNA (15 μg) was transfected into 2.5 x 10⁶ Hep3B cells by using 90-100 μg of Lipofectin reagent (BRL) and incubated for 5 hr in reduced-serum medium (Opti-MEM I; BRL). Cells were then placed in complete medium (5) with or without 50 μM CoC12 and incubated for 24-40 hr at 37°C in a 5% CO2/95% air incubator ("20% O2") or a closed chamber flushed with 1% O2/5% CO2/94% N2 ("1% O2"). Cell extracts were prepared and protein content was determined (Bio-Rad protein assay). CAT protein was quantitated by ELISA (5 Prime → 3 Prime, Inc.) using standard curves generated with purified CAT, after correction for values obtained from untransfected control plates. The ratio pg of CAT/mg of protein was normalized to the value for pSVcatSV in cells cultured in 20% O2.


